Nascar
Fun
Teacher Page
A Web Quest for 6th
Grade (Math, Writing, Technology)
Designed by
Nathan Crowder [email protected]
Melissa Dodson [email protected]
Lynn Edmonds [email protected]
Jerry Whittington [email protected]
Introduction
| Learners | Standards
| Process | Resources |
Evaluation
| Conclusion | Credits
| Student Page
Introduction
This lesson was developed
as a web quest project for Dr. Messner and Dr. Ulmer's Literacy, Technology,
and Instruction Spring 2002 class at Appalachian
State University .
This project is also
being used to fulfill the North Carolina
Advanced Technology
Competencies for Educators and potential educators. They are listed
here
for your reference. The specific competencies that were met by this web
quest are listed in the curriculum standards
section of the teacher page.
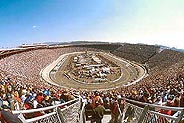
This web quest allows
students to work together to research a nascar race track. Students
will use technology, math, and writing skills to learn about their prospective
track and present their information to the rest of the class as part of
a NASCAR Celebration, intended to give students the opportunity to showcase
what they have learned.
Learners
This lesson is designed
for 6th grade. The focus of this lesson is on Math and Language Arts.
The students will use technology throughout the lesson.
Learners will need
to know basic computer skills such as word processing, keyboarding and
internet usage. Students will also need to have some background on
collecting data, making graphs through Microsoft Excel, searching the World
Wide Web, and working with Microsoft Works.
Curriculum
Standards
This web quest aligns
with several competency goals from the North
Carolina Standard Course of Study for sixth grade math, language arts
and computer and technology skills.
Math
Standards Addressed
Competency Goal
4: The learner will demonstrate an understanding and use of graphing,
probability, and data analysis.
4.01 Create and evaluate graphic representation of data.
4.05 Construct convincing arguments based on analysis of data and interpretation
of graphs.
Language
Arts Standards Addressed
Competency Goal
1: The learner will use language to express individual perspectives
drawn from personal or related experience.
1.03 Interact appropriately in group settings by:
-
listening attentively.
-
showing empathy.
-
contributing relevant
comments connecting personal experiences to content.
-
monitoring own understanding
of the discussion and seeking clarification as needed.
Competency Goal 2:
The learner will explore and analyze information from a variety of sources.
2.01 Explore informational materials that are read,
heard, and/or viewed by:
-
reviewing the characteristics
of informational works.
-
restating and summarizing
information.
-
determining the importance
of information.
-
making connections to
related topics/information.
-
monitoring comprehension.
-
drawing inferences.
-
generating questions.
2.02
Use multiple sources of print and non print information in developing informational
materials such as brochures, newsletters, and infomercials
-
by exploring a variety
of sources from which information may be attained (e.g., books, Internet,
electronic databases, CD-ROM).
-
distinguishing between
primary and secondary sources.
Technology
Standards Addressed
Competency Goal
2: The learner will demonstrate knowledge and skills in the use
of computer and other technologies.
2.1 Use keyboarding skills to increase productivity and accuracy. (KU/WP/DTP)
Competency Goal 3:
The learner will use a variety of technologies to access, analyze, interpret,
synthesize, apply, and communicate information.
3.1 Select and use technology tools to collect,
analyze, and display data. (SI)
3.2 Use word processing/desktop publishing
applications to create documents related to
content areas. (KU/WP/DTP)
3.5 Select most appropriate type of graph to
display data and state the reason. (SS)
Process
To begin each teams
quest, each member will be assigned a part in researching a championship
race track. Then you will all take part in convincing the rest of the class
that your track is number one! Good luck!
1.First
you'll be assigned to a team of 3 students, each group will choose a track
to research (make sure there is not another group doing your track already).
2. Then in your groups
you will decide on who will do each part of the task. (one person does
the statistical research, one does the history, and one makes a brochure).
3. After you have
chosen your part look below and click on the image that will take you to
instructions about your job.
4. Then after you
have completed your task, get back with your group and talk about what
you found out. Work together to create a presentation about your track
and why it is the best track in Nascar!
5.Be creative and
HAVE FUN!!!
STATISTICAL RESEARCH
BROCHURE
HISTORY OF THE TRACK
GROUP PRESENTATION
This lesson is
organized for both a math and a language arts class. Therefore, it
is interdisciplinary, requiring teacher cooperation and communication.
It is organized as
a group project/presentation. The groups need to be divided in to
groups of three. The best way to do this would be to randomly select
the groups. Do your best to have diverse groups for a wide range
of learning. This project could probably be completed in about two
weeks, if the students worked on it about an hour or so each day.
One stumbling block
you might run into is groups wanting to do the same track. One way
to get around this problem may be to have each group write down their top
three choices in order and tell them they are not guaranteed their first
choice. Another way to get around this may be just using a first-come-first-serve
basis. Students then know they must work together to make the decision
quickly.
One big part that
you are responsible is coordinating the NASCAR Celebration at the end.
Here are some possible suggestions to go along with the presentations at
the NASCAR Celebration:
-
Serve cake shaped and
decorated like a car.
-
Decorate the room with
checkered flags, balloons, and streamers.
-
Have pictures of cars
and tracks hanging all over the room.
-
If possible, dress like
a race car driver.
For this web quest,
you as the teacher need to have background in computer skills, specifically
in using Microsoft Works and Excel. You should also have a little
background in NASCAR race tracks, so that you know that the history of
the track is correct. You'll need to know how to access the internet.
Variations
One variation to
how this lesson could be executed would be to use it as a lab instead of
an in-class lesson. The students could be learning about statistics
and/or writing in class, and the web quest project would be a practical
way to practice what they learn.
Resources
Needed
There are several
resources you will need to implement this lesson:
-
Computer access for
all students
-
Internet access
-
Microsoft Office (Works
and Excel)
-
Floppy disks for each
student to save work
-
Coordination and communication
with other teachers
-
Possibly a video camera
for the Celebration
-
Possibly help from parents
for decoration and food for the Celebration
Evaluation
The following rubric
will be used to assess the students work.
There will be a common
grade for the entire group!
|
Red
Flag
(0-5 pts)
1 |
Caution
Flag
(6-10 pts)
2 |
White
Flag
(11-15 pts)
3 |
Checkered
Flag
(16-20 pts)
4 |
Score |
|
Group Interaction
|
Did not work
well with other group members. Lack of respect within group.
|
Worked fairly
well with other group members. One or two people did all the work.
|
Worked well
with other group members. Completed the majority of the task.
|
Worked extremely
well with other group members. Everyone played equal part in completing
the assignment.
|
|
|
Brochure
|
No brochure
is finished.
|
Some of the
brochure is complete, but there is not enough information in it.
There are many mistakes.
|
Most of the
brochure is complete, but there are a few mistakes.
|
The brochure
is complete with all the necessary information. There are no mistakes.
|
|
|
Statistics
|
No statistics
are presented in graphs.
|
Some statistics
are presented, but not clear.
|
Most statistics
are presented, but several are not clear.
|
Statistics are
presented clearly in graphs.
|
|
|
History
|
The paper is
not typed. It does not include necessary information.
|
The paper is
typed, but has many mistakes. Most of the necessary information is
left out.
|
The paper is
typed with few mistakes. Most of the necessary information is included.
|
The paper is
typed well with no mistakes. All the necessary information is included
in the paper.
|
|
|
Presentation
and Finished Product
|
Product is not
complete. The group does not present.
|
The product
is done, but there are "holes". The presentation is not in-depth
and not done well by any of the group members.
|
The product
is done with minor mistakes. The presentation is done well by only
1 or 2 group members.
|
The product
is done with no mistakes. The presentation is clear and done well.
|
|
Some possible questions
and guidelines that may be used to assess the students work:
Group Interaction
indicates how well the group worked together to achieve the end results.
Some questions that may be used to guide your appraisal are:
Did they group solve
their disputes in a reasonable manner?
Did all of the group
members contribute or did one person do most of the work?
Did the group set
appropriate goals for themselves?
Did the group come
to mutual decisions about the nature of the end product?
Did the group spend
their time wisely?
Was appropriate
time set outside of class to complete the project?
You may wish to have
each group member complete a small write-up after the project is competed
where they state whether or not they felt the group worked well together
and why or why not.
Brochure indicates
how attractive and complete the brochure is. A 1 should be no brochure
at all. A 4 should not only include relevant data but should be professional
in appearance and should stand out above the others.
Statistics Where
statistics used in an appropriate way? Were graphs used to represent
the statistics in a way that is easy to understand and makes sense?
Is the math correct? Are the graphs attractive and professional?
History-Does
the paper show effective use of resources? Is the paper in the own
students words? Are there few errors in grammar? Is the paper
in-depth? Does it show adequate time invested? Are sources
appropriately documented?
Presentation and
finished product- Are the students well prepared? Do they seem
to know their subject well? Do they divide up how they are going
to speak in an effective manner?
Conclusion
Hopefully, students
will learn about Nascar in a way that is fun, yet teaches fundamental lessons
in math and language arts. Students should also have a new aspect
on how to use technology and work better within a group setting.
Credits
& References
Web Pages:
www.iespana.es/amazingsounds/
This is a great site for sounds of all kinds, some of which are
included on this site.
www.nascar.com
This is a great web site for any and all NASCAR information you
need. This site contains track information, statistics, drivers'
names, pictures, schedule, etc.
www.google.com
This is a great search engine that students can use to search for
any information.
rpm.espn.com
The website containing your latest NASCAR news.
www.gast-gazette.com
This is a good site for finding the history of the race tracks.
sports.yahoo.com/rac/nascar/
This is a great site to get the latest race results for each track.
We also give special thanks to Dr. Spagnolo of Appalachian State
University!
Last updated on
August 15, 1999. Based on a
template from The
Web Quest Page |